|
A high-performance general-purpose compute library
|
|
A high-performance general-purpose compute library
|
Arrayfire as a library aims to provide a robust and easy to use platform for high-performance, parallel and GPU computing.
The goal of Forge, an OpenGL visualization library, is to provide equally robust visualizations that are interoperable between Arrayfire data-structures and an OpenGL context.
Arrayfire provides wrapper functions that are designed to be a simple interface to visualize af::arrays. These functions perform various interop tasks. One in particular is that instead of wasting time copying and reformatting data from the GPU to the host and back to the GPU, we can draw directly from GPU-data to GPU-framebuffers! This saves 2 memory copies.
Visualizations can be manipulated with a mouse. The following actions are available:
Let's see exactly what visuals we can illuminate with forge and how Arrayfire anneals the data between the two libraries.
Before we can call Forge functions, we need to set up the related "canvas" classes. Forge functions are tied to the af::Window class. First let's create a window:
We also added a drawing loop, so now we can use Forge's drawing functions to draw to the window. The drawing functions present in Forge are listed below.
Documentation for rendering functions can be found here.
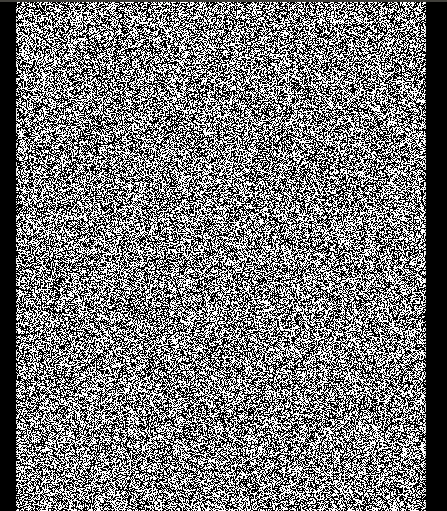
The af::Window::image() function can be used to plot grayscale or color images. To plot a grayscale image a 2d array should be passed into the function. Let's see this on a static noise example:
 Tweaking the previous example by giving our image a depth of 3 for the RGB values allows us to generate colorful noise:
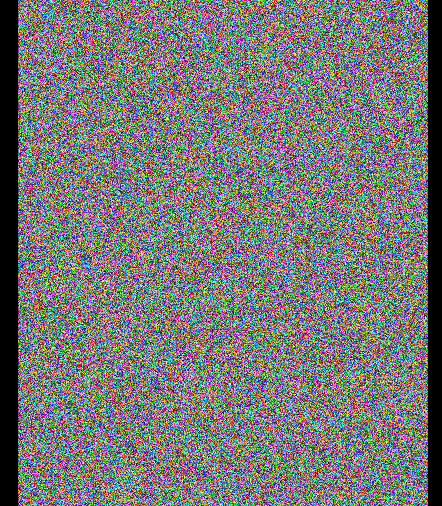 Note that Forge automatically handles any af::array type passed from Arrayfire. In the first example we passed in an image of floats in the range [0, 1]. In the last example we cast our array to an unsigned byte array with the range [0, 255]. The type-handling properties are consistent for all Forge drawing functions.
The af::Window::plot() function visualizes an array as a 2d-line plot. Let's see a simple example:
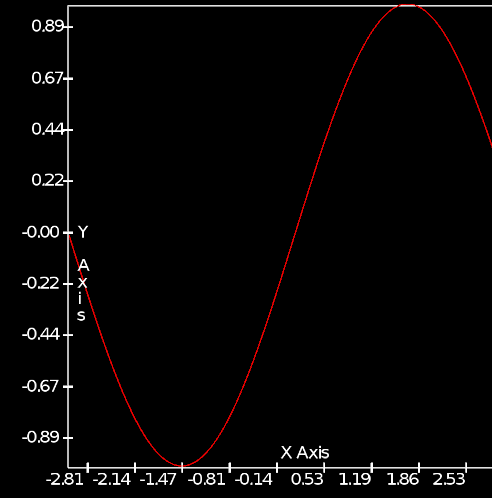 The plot function has the signature:
void plot( const array &X, const array &Y, const char * const title = NULL );
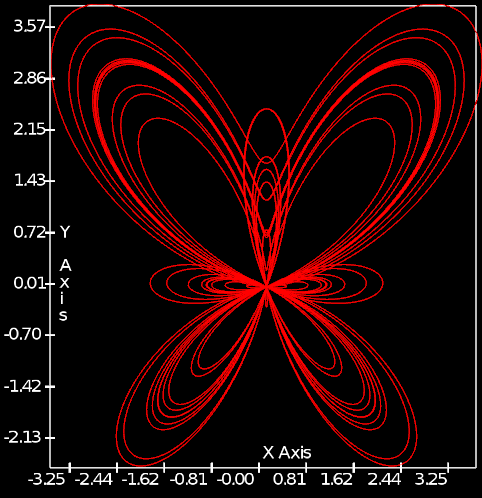
Both the x and y coordinates of the points are required to plot. This allows for non-uniform, or parametric plots:
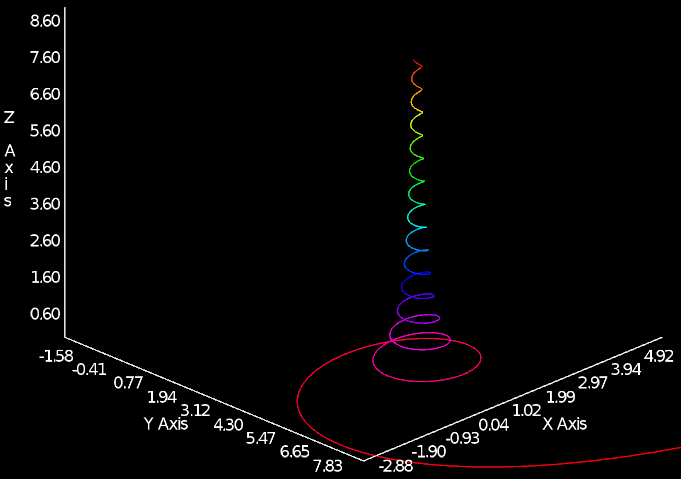
The af::Window::plot3() function will plot a curve in 3d-space. Its signature is:
void plot3 (const array &in, const char * title = NULL);
The input array expects xyz-triplets in sequential order. The points can be in a flattened one dimensional (3n x 1) array, or in one of the (3 x n), (n x 3) matrix forms.
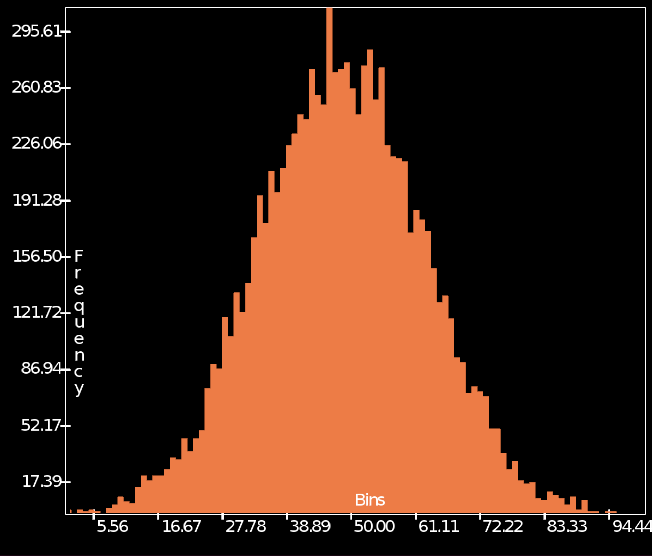
The af::Window::hist() function renders an input array as a histogram. In our example, the input array will be created with Arrayfire's histogram() function, which actually counts and bins each sample. The output from histogram() can directly be fed into the af::Window::hist() rendering function.
In addition to the histogram array with the number of samples in each bin, the af::Window::hist() function takes two additional parameters – the minimum and maximum values of all datapoints in the histogram array. This effectively sets the range of the binned data. The full signature of af::Window::hist() is:
void hist(const array & X, const double minval, const double maxval, const char * const title = NULL);
The af::Window::surface() function will plot af::arrays as a 3d surface.
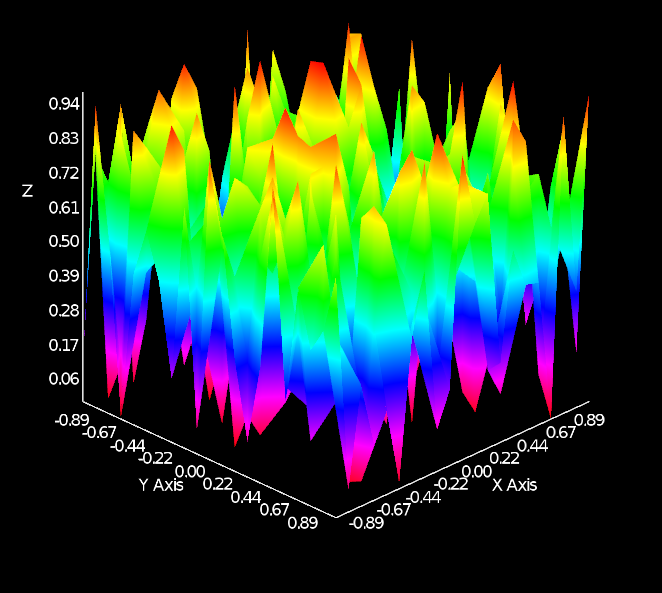 There are two overloads for the af::Window::surface() function:
void surface (const array & S, const char * const title ) // Accepts a 2d matrix with the z values of the surface
void surface (const array &xVals, const array &yVals, const array &S, const char * const title) // accepts additional vectors that define the x,y coordinates for the surface points.
The second overload has two options for the x, y coordinate vectors. Assuming a surface grid of size m x n:
There is a fairly comprehensive collection of methods to visualize data in Arrayfire. Thanks to the high-performance gpu plotting library Forge, the provided Arrayfire functions not only make visualizations as simple as possible, but keep them as robust as the rest of the Arrayfire library.